Location Analytics: Battle of Neighborhoods
Summary
This data science capstone project deals with the process of leveraging location data acquired from data providers such as Foursquare to explore the neighborhoods within a targeted city and create clustering models. Using K-means cluster, similar locations with minimum distance shall be grouped into clusters. It is the simplest form of unsupervised machine learning algorithm and it helps in grouping similar data points. Utilizing this model, I intend to create a solution for small scale business start-ups who are exploring ideal locations to establish their small scale business in an urban locality.
Introduction
With the conclusion of my data science course, I am now committed towards performing my first capstone project. Luckily, the project deals with my domain of expertise- “Geographic Information System” i.e G-I-S!. Coming from a non-coding background, I believe that it is more easier to understand the functionality of the codes when you are applying them to your domain. So, without much further ado, I would like to start my blog with a few insights into “Location Analytics”- the next big step in GIS & business analytics.
About Location Analytics
Location Analytics is one of the most impressive way of visualizing our key business performance indicators or any other key indicator for that matter.
This machine learning algorithm can be performed using historical geographic data as well as real-time location data. Real-time geographic data can be acquired through third party APIs that can used further to formulate business solutions. For instance, in one of their applications, ESRI discusses the role of location intelligence changing the scenery of retail industry.
“Geography brings together and allows us to analyze different data using location indicators, from the ping of an iBeacon, to a barcode scan, to where a coupon is used, to tracking anonymous shoppers in stores and malls.” - From Bricks to Clicks: How Location Intelligence is Changing Retail, ESRI Insider

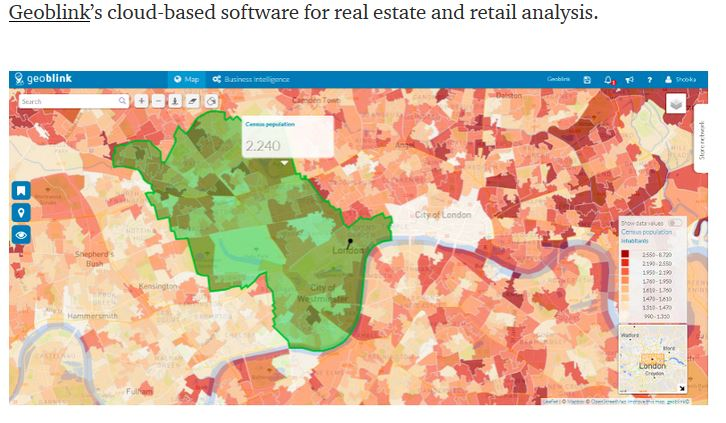
Using location analytics, businesses are able to make strategic decisions based on insights gained through the geography of a region. Furthermore, the application harnesses the potential of geographic data to create an integrative and analytical platform for a high performance business supply chain. An ideal example in this regards would be Geoblink’s cloud based software for real estate and retail analytics which is based on the concept of maps and visualization. It uses geography as its best business tool for strategic planning.
Capstone Project
Project Objectives
Identify an ideal business location for a cafe startup by considering areas/localities/boroughs that
- High frequency of office and colleges in the neighborhood
- Low frequency of cafes in the localities/boroughs
Approach
Using location as a strategy, businesses analyze seemingly different data for patterns and trends in their occurrence within a geographic region. Moreover, by visualizing the data, relationships can be identified that are crucial for strategic business planning. So in light of this, I built my first capstone project in machine learning to solve the most common challenge that majority of the businesses face in establishing their market coverage.
One of the most rudimentary problems faced by most of the business startups include spotting ideal locations for their trade with minimum competition from similar businesses. Hence, I worked on the basics of utilizing machine learning techniques, more specifically clustering method, to identify ideal geographical locations. I also accessed third party geo-location data provided by APIs such as Foursquare, Google etc.
So, coming back to my data science question- How do I identify the ideal neighborhoods for setting up a local cafe/coffee shop?
For this project, I intended to analyze the neighborhoods of Toronto city to identify ideal locations for starting out a small local cafe business. Hence, to that effect, I used basic postal code information extracted from the Wikipedia page using Python’s web scraping libraries such as Beautiful Soup. Now post data extraction and transformation, I connected to the third party APIs providing location data such as Foursquare to extract information on the most popular venues that are located within a radius of one kilometer.

Using the above python code, the list of nearby venues were extracted using the location data provider’s API and rendered onto the map of Toronto city as indicated below.

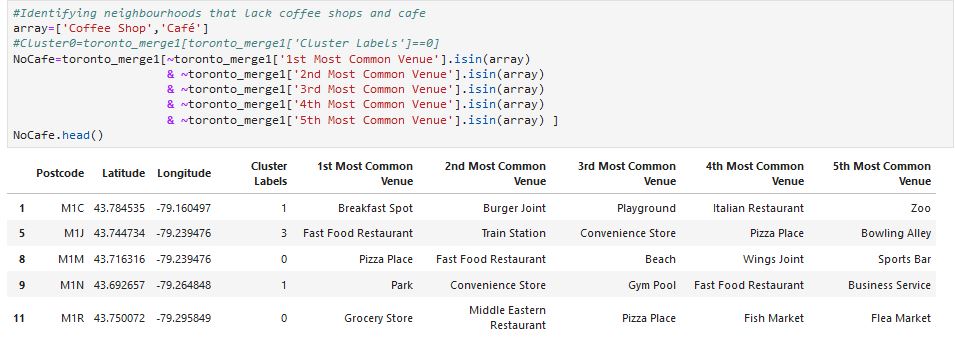
Now, in order to create a common cluster of regions that are devoid of any nearby Cafe’s, I ran the following machine learning algorithm using k-means clustering technique.
K-means Clustering is a machine learning algorithm for unsupervised classification. The algorithm works iteratively to find data groups with similar features that are defined by the variable K. In this method the groups are formed based on the group’s centroid feature which is the measure of the feature values of the data points.
Machine Learning: K-means Clustering Technique
Using the machine learning algorithm of k-means cluster, I was able to spot similar regions/neighborhoods within a radius of one kilometer that lacked proper coffee shops and cafe’s.

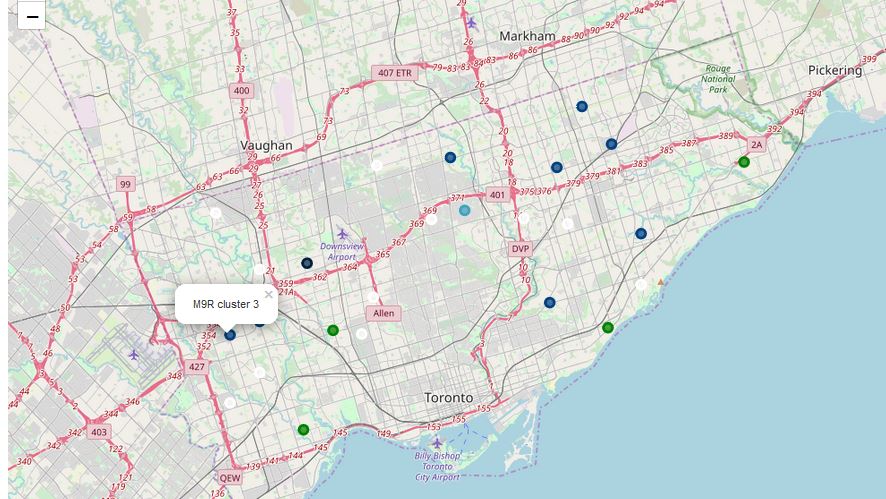
These regions therefore, presented themselves as the most ideal locations for proposing the establishment of a small local cafe due to minimum or lack of competition as visualized in the map below.

